Charts
Chart XCommon
Axis
To add axes x, y, z to a 3D chart, create xv.chart.Axisys together with xv.XComponents.Axes to add the arrow objects.
test: html/ext/12vec-bar.html
Axis can be configured in json file’s chart section:
{ "chart": {
...
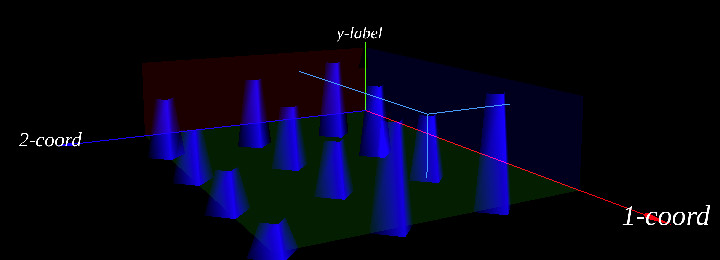
"axes": ["1-coord", "y-label", "2-coord"],
"label-sytle": ["white", "white", "white"],
"label-font": "italic 8em \"Fira Sans\", serif"
}
}
The above configuration will produce the following font visualization.
The label-style and label-font are used as canvas style and font attribute, the same as html canvas style, see MDN Canvas.style and css font.
Also note that in version 0.3, all axis labels are using a 256x256 canvas for rendering, with text at x = 0, y = 128. Configuration for longer string will have to be adjusted by user.
Visual Auxiliaries
This includes showing a group of 3 axis planes and a group of value indicating lines that always start from the planes.
test: html/ext/12vec-bar.html & html/ext/chart-grid.html
Chart Extensions
XBar
Using json object generating a 3D bar chart.
test: html/ext/12vec-bar.html
Data Serial Labels
Serial labels are text strings that shows along axis, etc.
XBar currently support only 3 groups of labels, along x, y, z respectively.
To configure XBar chart x, y, z labels serials, in the json.bar section:
{ "bar": {
      "pos0": [1, 0, 1],
      "offsets": [[0, -0.1, 0], [-0.1, 0.5, -0.1], [0, -0.1, 0]],

      "label-desc": "in bar serials, labels always a 2d array of stirngs, with rows' cardinality of 3",
      "labels": [ ["A", "B", "C"],
                  ["X"],
                  ["- I -", "- II -", "- III -"] ],
      "label-colors": ["red", "green", "#24f"],
      "label-font": "4em Arial",
      "label-canvas": {"x": 0, "y": 280, "w": 256, "h": 256},
      "label-box": [20, 20],
  }
}
In the above json data, the labels can only be a 3 elements array, each is an array of strings that will be showed in chart.
The pos0 defined offsets alone x, y, z respectively, i.e. offset[0] = 1 defined label [“A”, “B”, “C”] move alone x in one grid.
The offsets defined offsets of each label plane, i.e. offset[0] = [0, -0.1, 0] defined label “A”, “B” & “C” move alone -y in 0.1 grid space.
The label-box parameters are in world unit, the same as Obj3.box parameter.
Json Example: test/html/data/bar-2.json
D3Pie
Draw a pie chart on a 3D plane in xworld.
test: html/ext/4vec-pie.html
data: html/data/pie.json
1 2 3 4 5 6 7 8 9 10 11 12 13 14 | $.getJSON('../data/pie.json', function(json){
const xworld = new xv.XWorld(document.getElementById('canv'), window);
const ecs = xworld.xecs;
const xscene = xworld.xscene;
var d3pie = new xv.chart.D3Pie(ecs,
{ stub: 'stub',
xy: [0, 25], // texture start offset
xworld, chart: json.chart
}, json.pie);
xworld.addSystem('chart', d3pie);
xworld.addSystem('test', new TestD3Pie(ecs, {xworld, d3pie}));
xworld.startUpdate();
})
|
In above code, the D3Pie system is created for rendering a D3 pie chart as a 3D plane object.
Note:
In a page using D3Pie, the html/body needs providing a special div before the canvas used for main scene, such as
<body>
  <div id='stub'></div>
  <canvas id='canv'></canvas>
</body>
This is a tested results required by the depending Html2Texture plug in, and could be subtle to debug if not have a div like this.